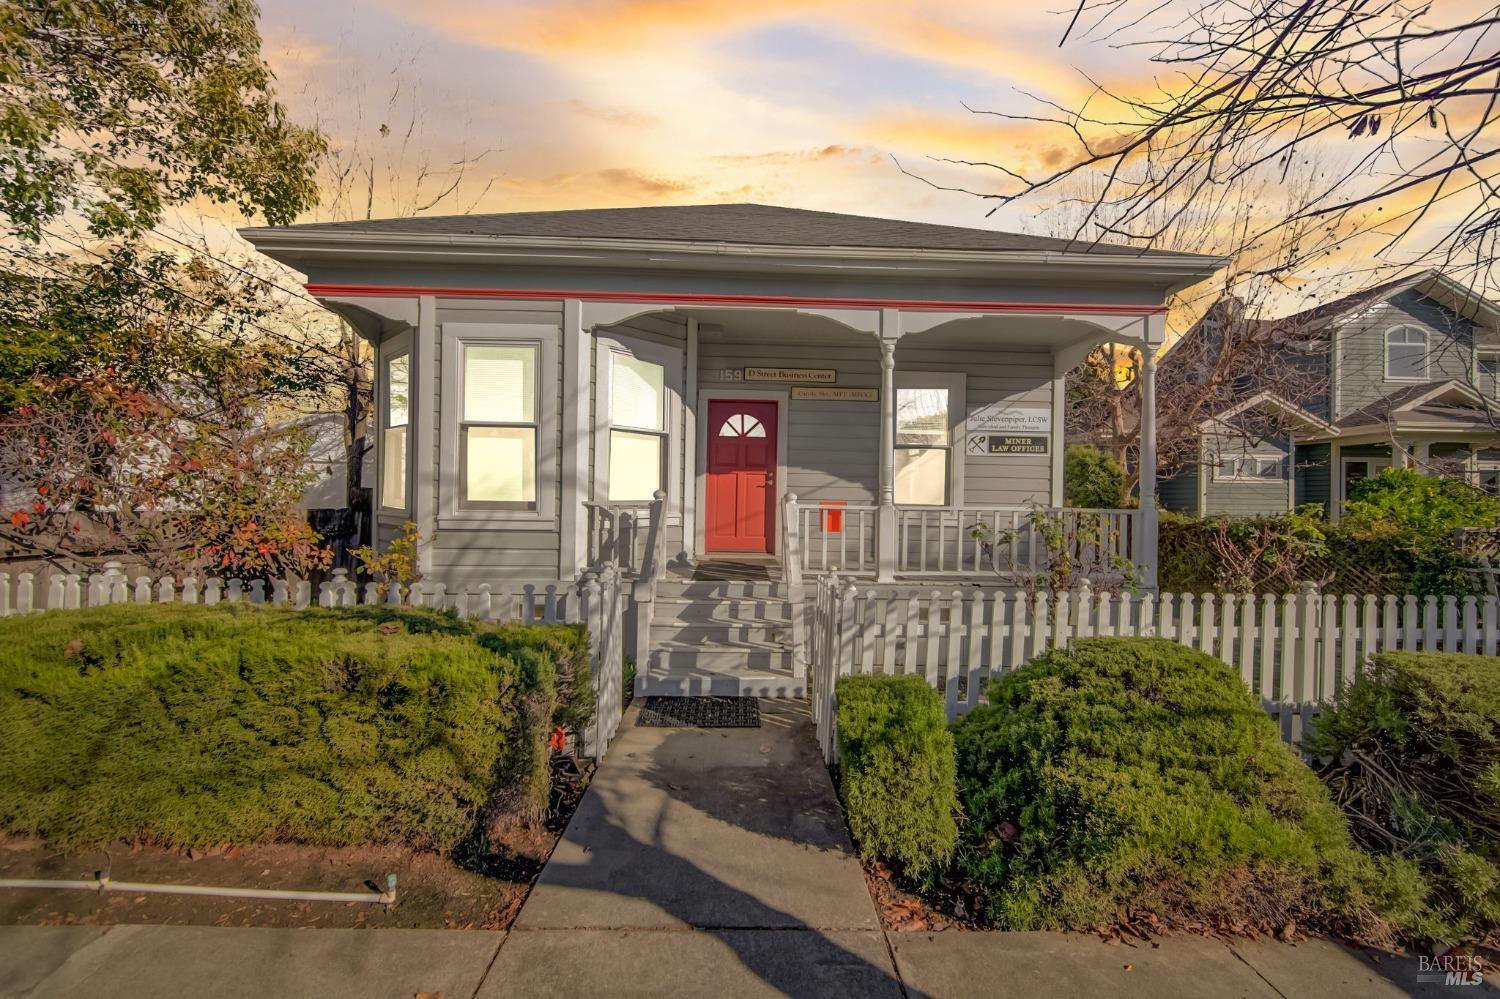
Benicia is a waterside city in Solano County, located in the North Bay region of the San Francisco Bay Area. It served as the capital of California for nearly thirteen months from 1853 to 1854. The population was 26,997 at the 2010 United States Census. The city is located along the north bank of the Carquinez Strait. Benicia is just east of Vallejo and across the strait from Martinez.
Northeast of the town's residential areas an oil refinery was built and completed in 1969 by Humble Oil (later Exxon Corporation). The refinery was later bought by Valero Energy Corporation, a San Antonio-based oil company, in 2000.
Between 1970 and 1995, the population of Benicia grew steadily at a rate of about 1,000 people per year, and the city changed from a poor, blue-collar town of 7,000 to a white-collar bedroom suburb of 27,000.
Commercial Real Estate
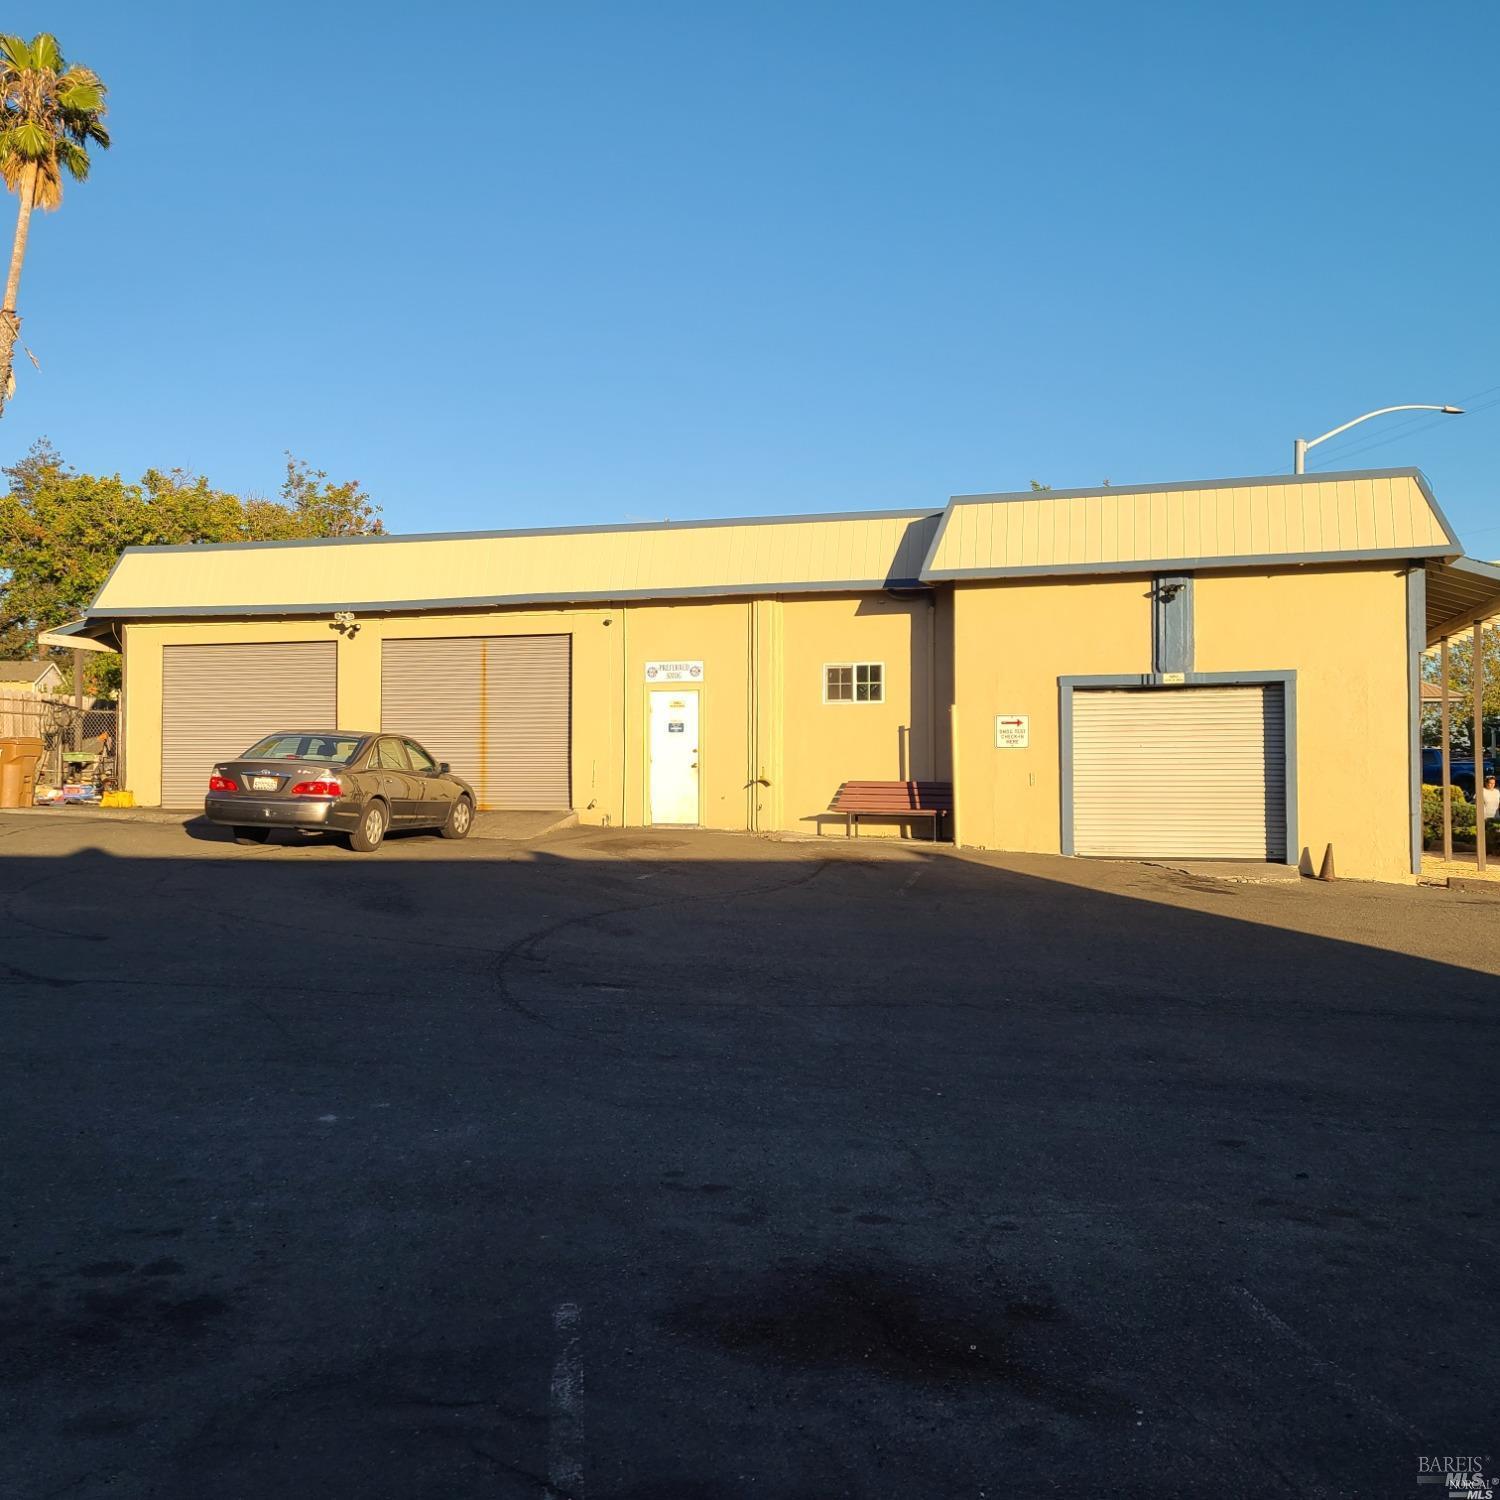
The Benicia area has all of the different categories of commercial real estate that you would expect in a fast growing region: manufacturing facilities, retail stores, office buildings, flex space properties, research and development facilities, warehouses, industrial properties, commercial land, agricultural and ranch properties, restaurants and other hospitality properties, hotels and resorts, multifamily properties, medical offices, distribution centers, mixed use properties, self storage facilities, mobile home parks or RV parks, cold storage facilities and other specialty properties.
Residential Real Estate
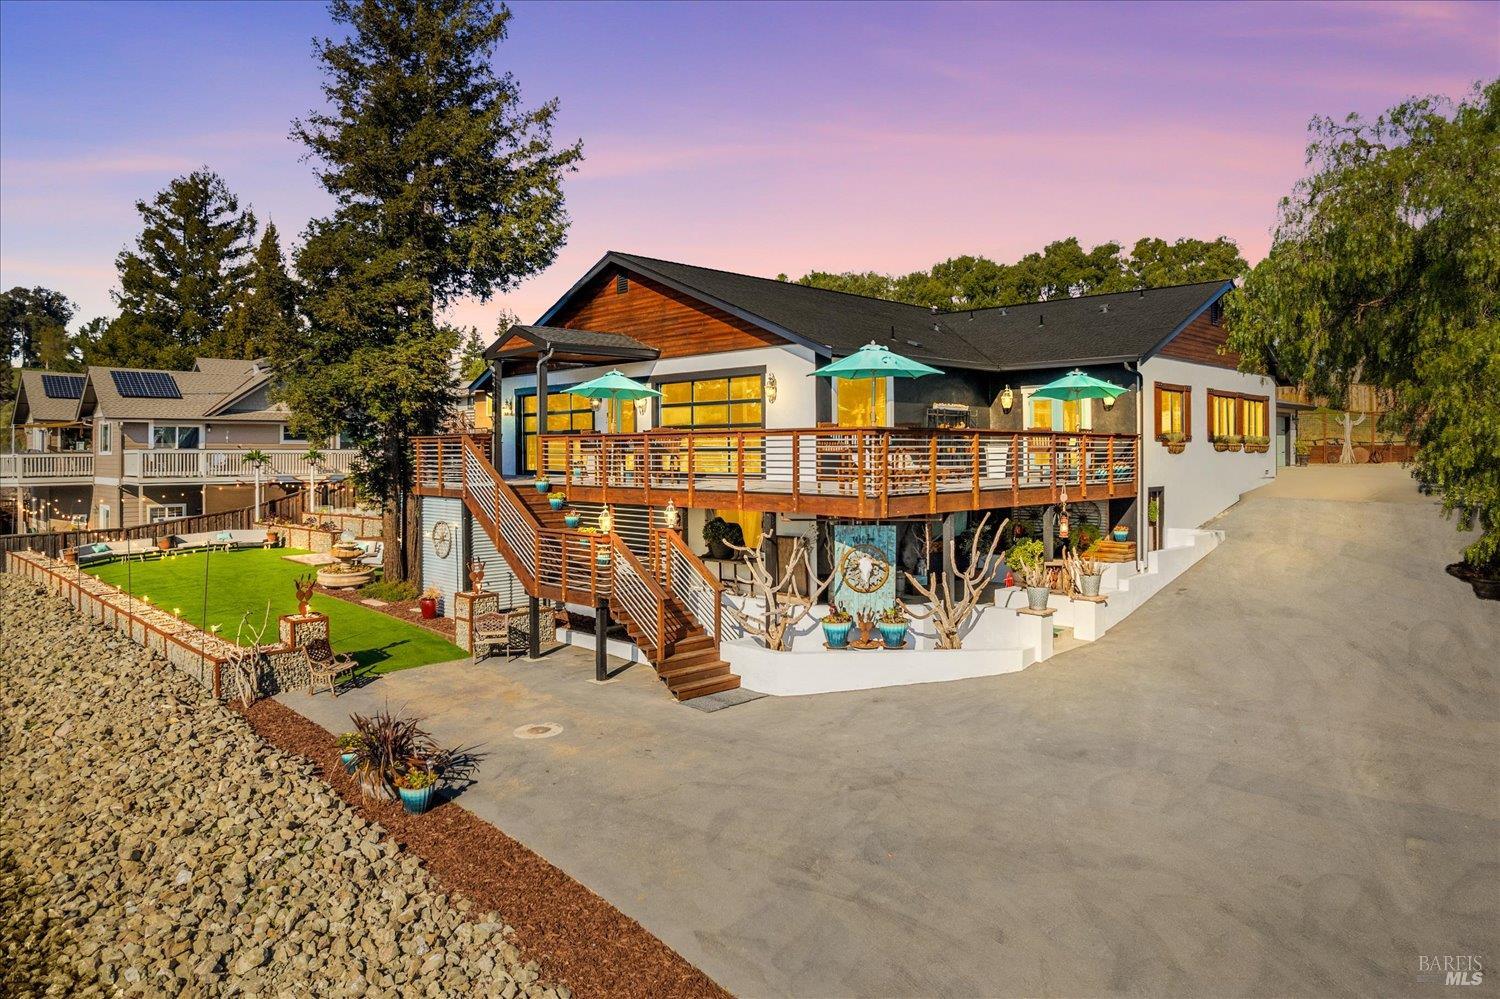
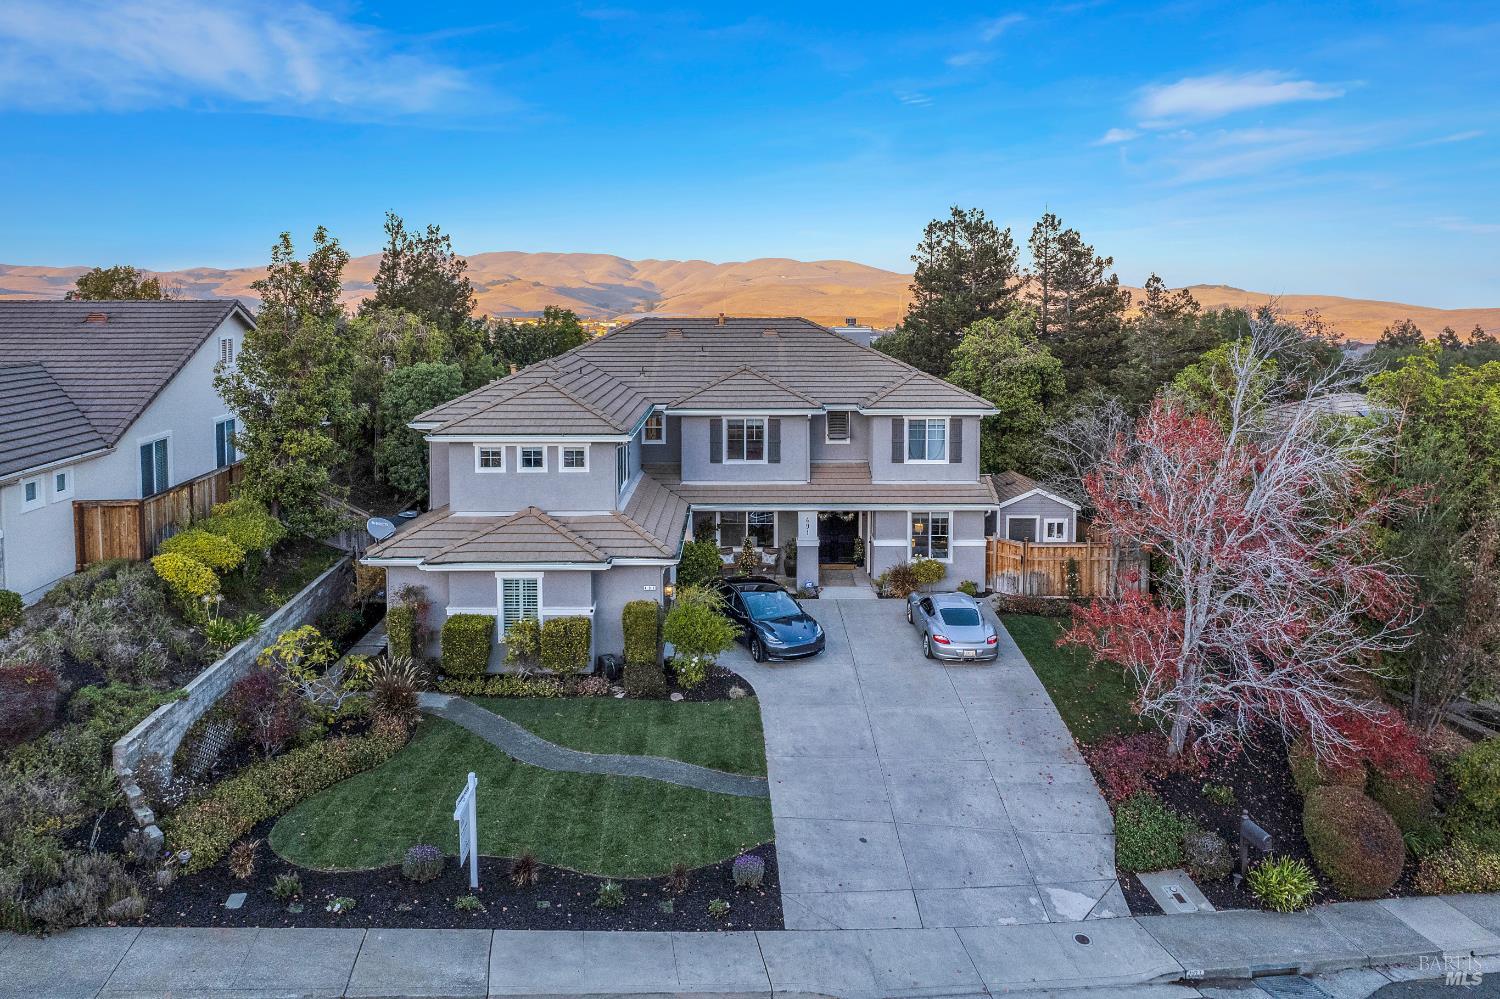
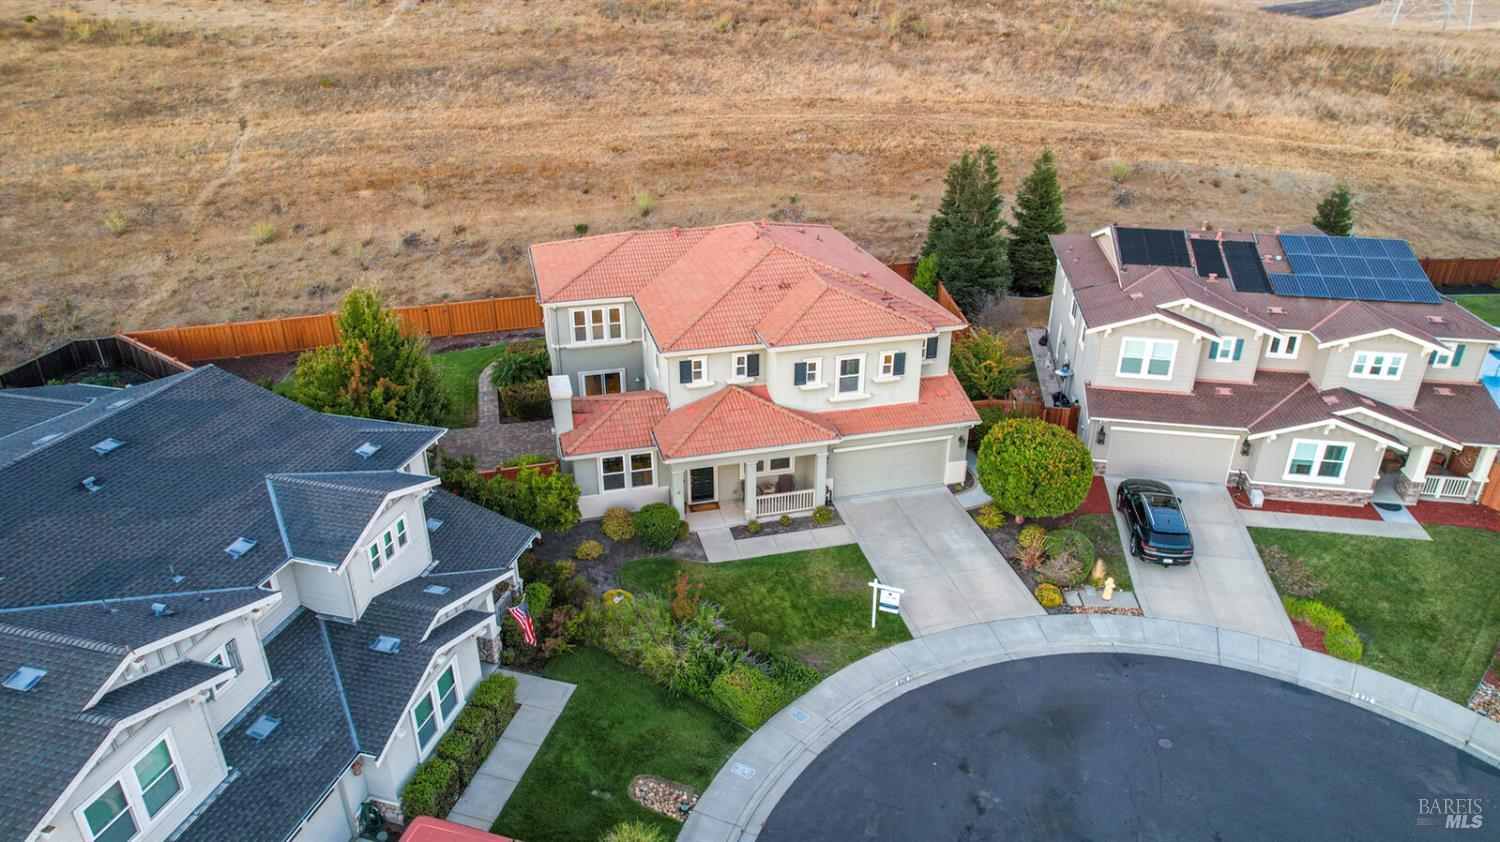
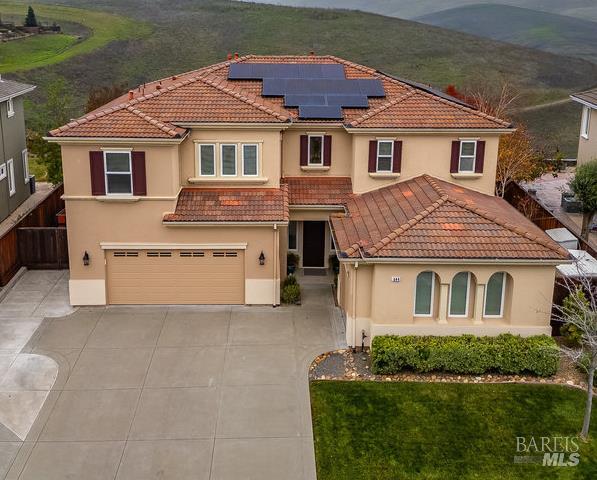
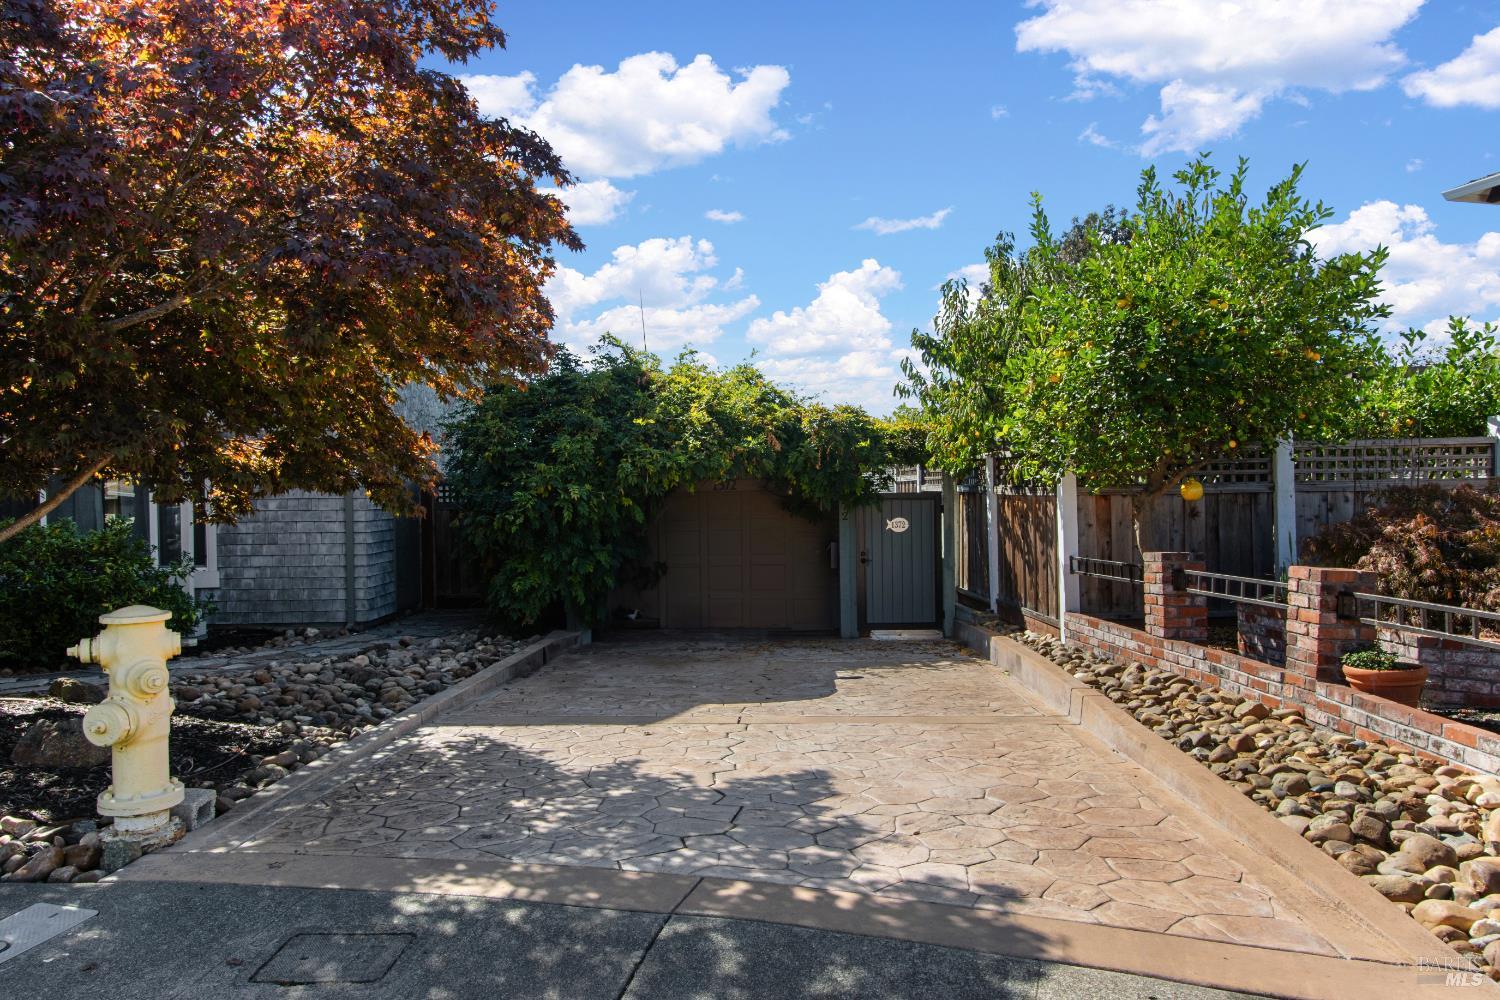
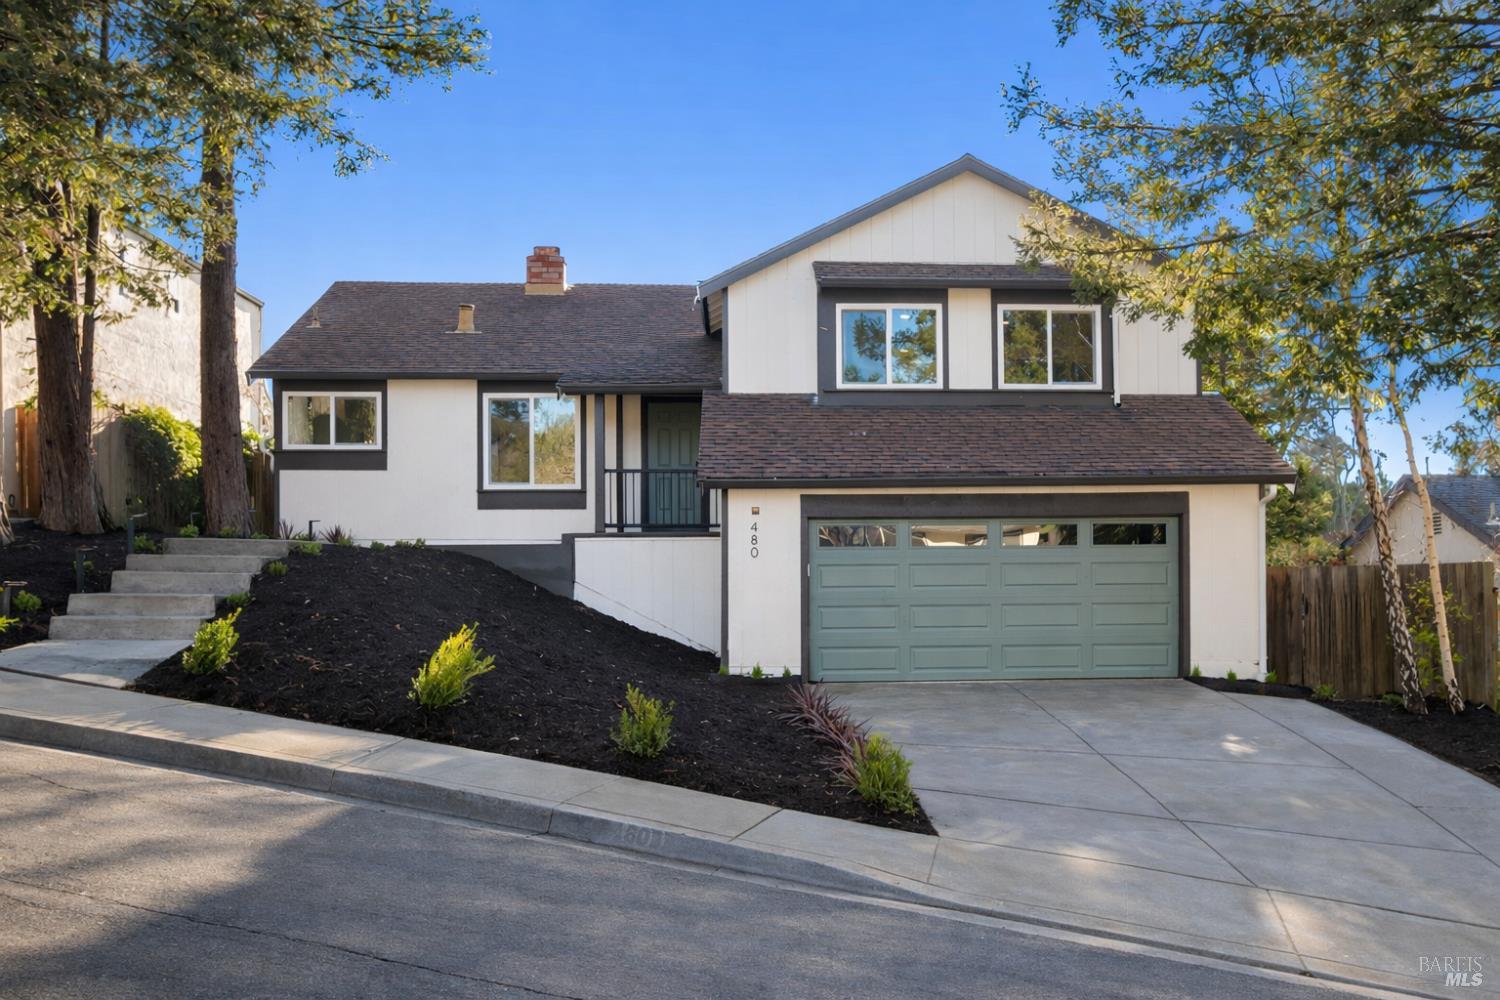
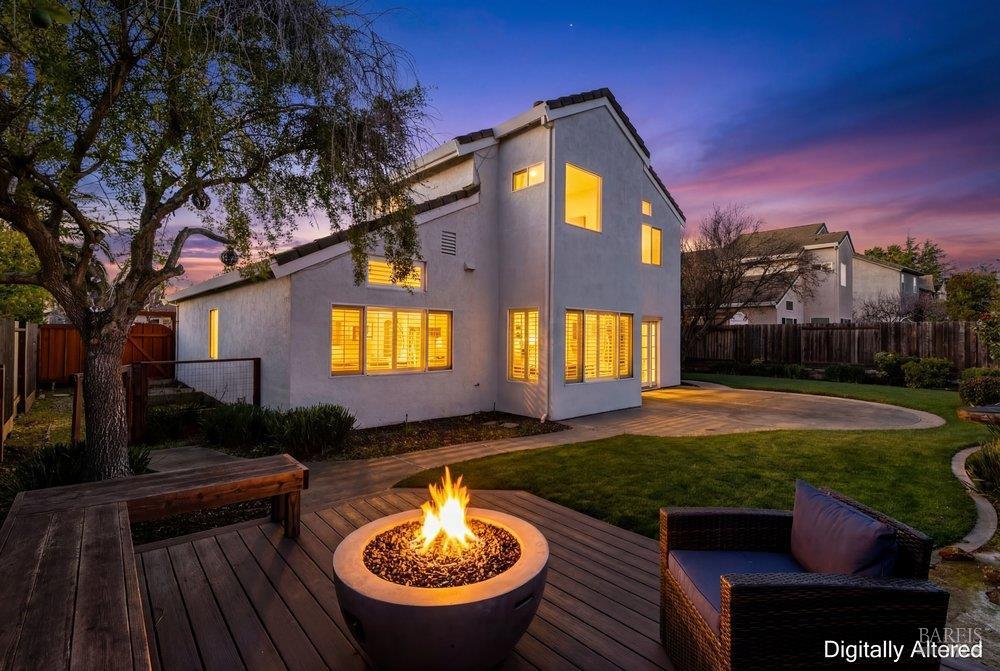
The local residents of Benicia have a lot of real estate options to select from when seeking their new home. There are a wide range of waterfront properties, single family homes in new subdivisions, single family homes in older subdivisions, townhouses, and apartments and also custom built homes on large lots, in addition to a range of residential buildable lots. If you are seeking a home in a waterfront community then Benicia also has exactly what you are seeking.
27,191 people live in Benicia, where the median age is 45.1 and the average individual income is $56,846. Data provided by the U.S. Census Bureau.
Total Population
Median Age
Population Density Population Density This is the number of people per square mile in a neighborhood.
Average individual Income
There's plenty to do around Benicia, including shopping, dining, nightlife, parks, and more. Data provided by Walk Score and Yelp.
Explore popular things to do in the area, including Fit4Yu, Fantasy Faces, and Moves Dance Academy.
Name | Category | Distance | Reviews |
Ratings by
Yelp
|
---|---|---|---|---|
Active | 4.63 miles | 27 reviews | 5/5 stars | |
Active | 4.41 miles | 49 reviews | 5/5 stars | |
Active | 1.47 miles | 13 reviews | 5/5 stars | |
Active | 1.16 miles | 14 reviews | 5/5 stars | |
Beauty | 3.96 miles | 16 reviews | 5/5 stars | |
Beauty | 1.97 miles | 7 reviews | 5/5 stars | |
Beauty | 1.51 miles | 6 reviews | 5/5 stars | |
|
||||
|
||||
|
||||
|
||||
|
||||
|
Benicia has 10,844 households, with an average household size of 2.51. Data provided by the U.S. Census Bureau. Here’s what the people living in Benicia do for work — and how long it takes them to get there. Data provided by the U.S. Census Bureau. 27,191 people call Benicia home. The population density is 2,122.15 and the largest age group is Data provided by the U.S. Census Bureau.
Total Population
Population Density Population Density This is the number of people per square mile in a neighborhood.
Median Age
Men vs Women
Population by Age Group
0-9 Years
10-17 Years
18-24 Years
25-64 Years
65-74 Years
75+ Years
Education Level
Total Households
Average Household Size
Average individual Income
Households with Children
With Children:
Without Children:
Marital Status
Blue vs White Collar Workers
Blue Collar:
White Collar:
Get assistance in determining current property value, crafting a competitive offer, writing and negotiating a contract, and much more. Contact us today.